Configuring Bar, Area and Line Charts
Overview
Bar Chart
A versatile choice for comparing categories of data. Each category is represented by a rectangular bar proportional to its value, making it easy to see at a glance which category has the highest or lowest value. Bar charts are also effective for visualizing data that is not evenly distributed, as the bar lengths clearly depict the differences.
Line Chart
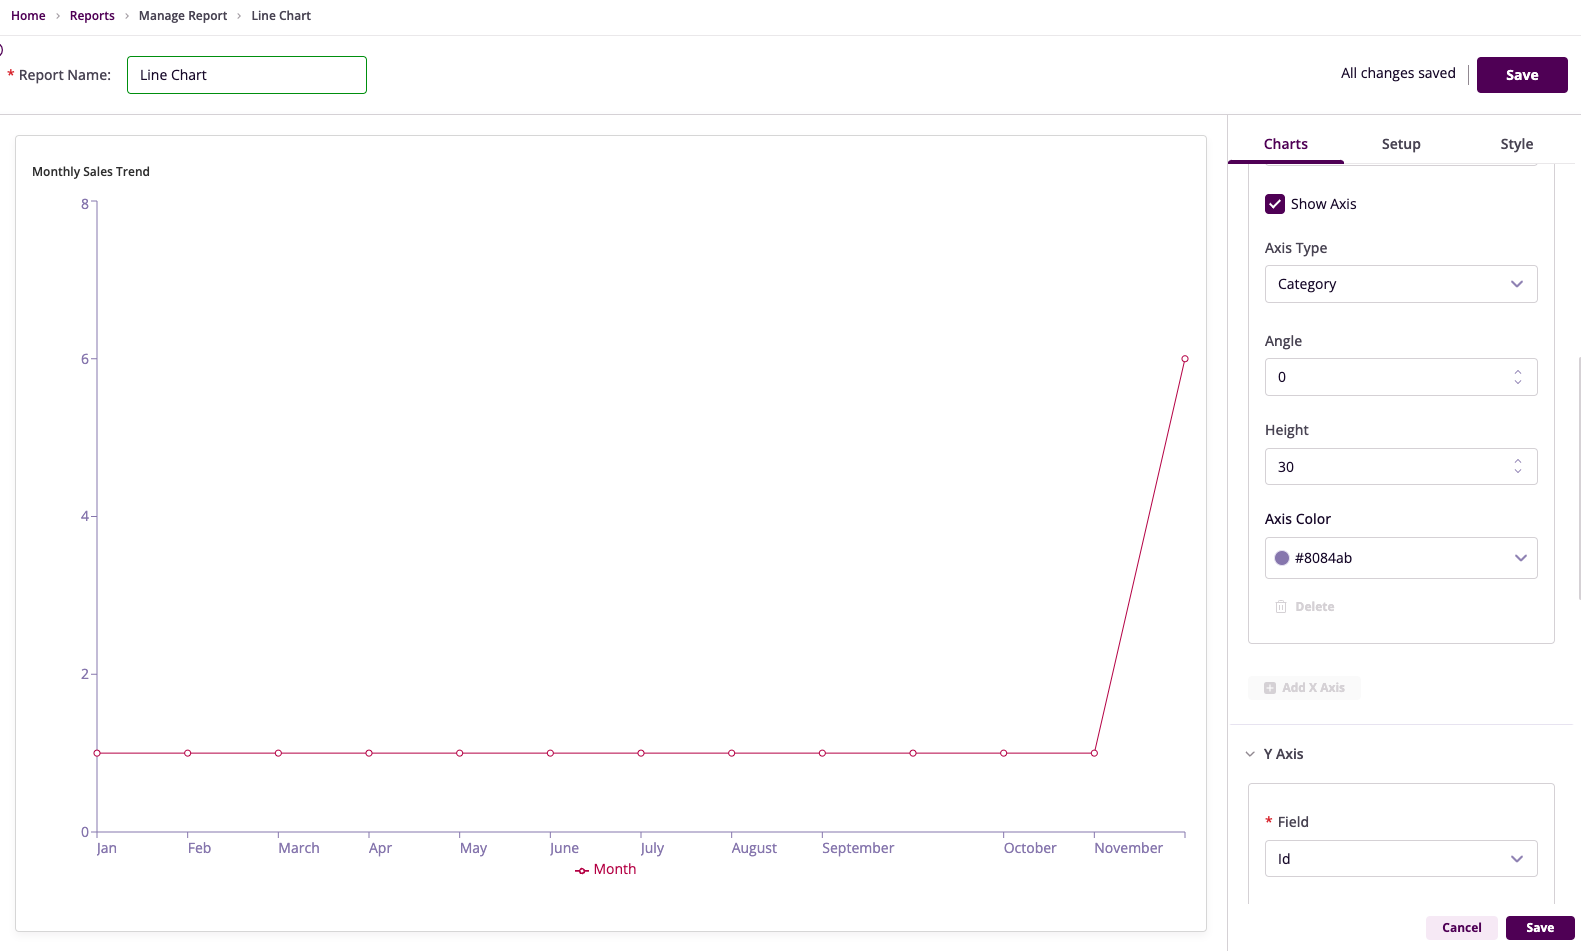
A powerful tool for tracking trends and identifying patterns over time. Line charts connect data points with a line, allowing you to visualize how a metric has changed over a specific period. This makes it easy to see if a metric is increasing, decreasing, or remaining stable. Line charts are particularly useful for visualizing continuous data, such as sales figures, website traffic, or stock prices.
Area Chart
While line charts focus on the trend itself, area charts emphasize the magnitude of change over time. Area charts create a shaded area beneath the line, highlighting the overall volume or flow of a metric. This can be helpful for visualizing how much total value has been accumulated over time, such as total sales or website traffic.
Getting Started
To begin, ensure you have:
- A clear idea of the insights you aim to extract from your data
- Access to InsightsIQ and the relevant datasets
- A report created to house your visualizations
Steps to Create a Report
- Navigate to the Reports Listing page
- Click the +New Report button
- Name your report and proceed to add visualizations
Chart Configuration
Select the Chart Type
From the visualization panel, choose the type of chart you want to create: Bar Chart, Area Chart, or Line Chart.
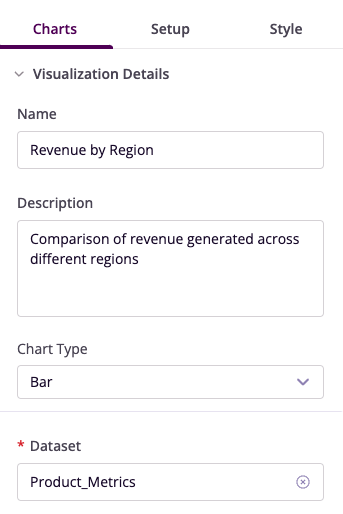
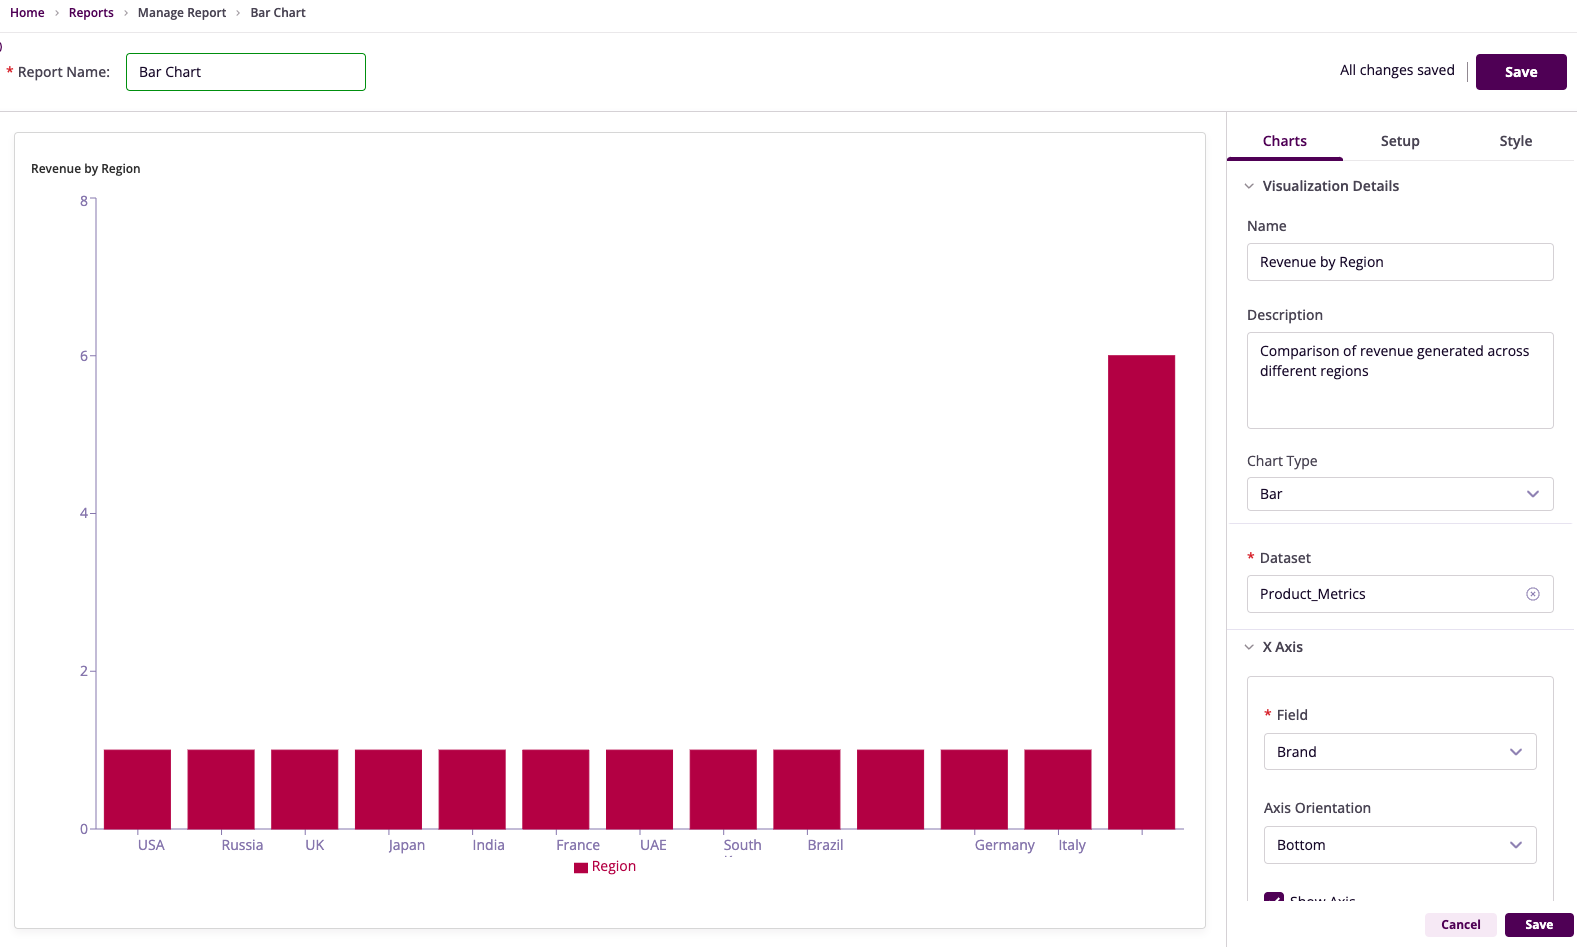
Basic Configuration
- Name: Enter a descriptive name for your chart
- Description: Add context about what the chart represents
- Dataset: Select the relevant dataset
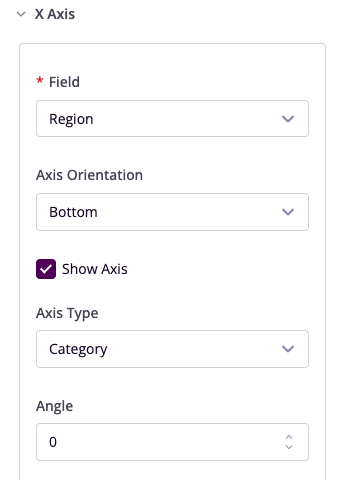
X-Axis Configuration
- Field: Choose the data column for the X-axis
- Orientation: Place labels at bottom or top
- Show Axis Button: Toggle axis visibility
- Type: Categories or numerical values
- Angle: Adjust label angle
- Height: Set axis height
- Color: Customize axis color
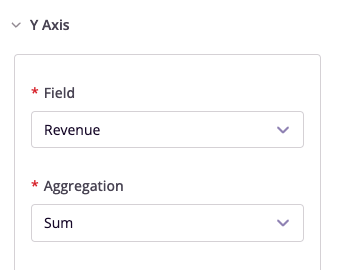
Y-Axis Configuration
- Field: Select data column
- Aggregation: Choose summary method
- Alias: Provide field alias
- Show Axis Button: Toggle visibility
- Orientation: Left/Right
- Stacked: Enable for Bar/Area charts
- Line Type: Select style for Line charts
- Colors: Customize axis and elements
Advanced Features
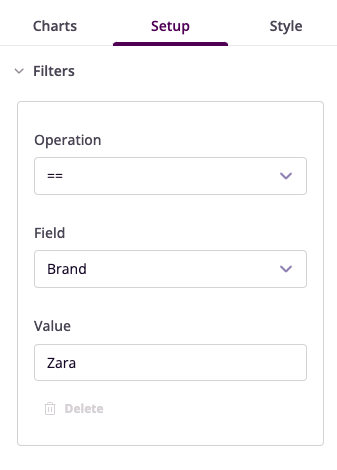
Filters
Configure data filters to refine your visualization:
- Operation: Select conditional operator
- Field: Choose column to filter
- Value: Set filter criteria
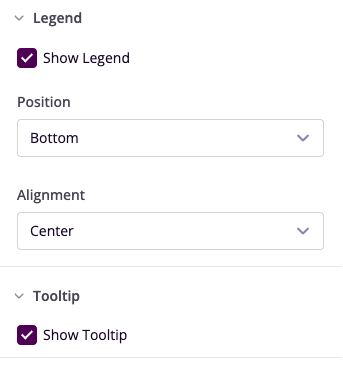
Legend and Tooltip
- Show Legend: Toggle visibility
- Position: Set legend location
- Alignment: Left/Center/Right
- Show Tooltip: Enable/disable tooltips
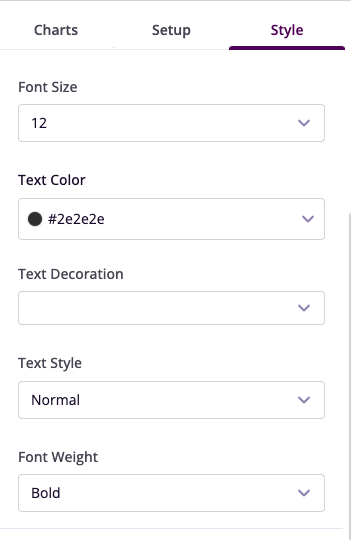
Style Customization
- Card Style: Choose border color
- Title Style: Configure font properties
- Grid: Toggle horizontal/vertical gridlines
Example Visualizations
Revenue by Region
Monthly Sales Trend